


Today we have a post from Vincent Ferreux of Alter&Coop, who used J&D Multi-GEM 18 meters from Aim Dynamics to create an energy management solution for the recycling industry.
Alter&Coop is a French cooperative that develops energy efficiency and solar panel solutions.
A year ago, we developed an entire Smart Energies Management solution for the recycling industry in Lons-le-Saunier, France.
Our system is based on two J&D Multi-GEM 18 meters, one Multi-GEM 12 Modbus Multichannel AC Watt Meter, and many other sensors. For example, it includes the Enedis’ TIC Gateway meter, compressor gateway, HVAC module, light management, Air Quality sensors, and more.
The flexibility of the Multi-GEMs lets us use AC current sensors with different ratings. We used 3 Flexible Rogowski Coil CTs at 1000A monitor the main source. Then, no less than 45 split core current sensors from JCXXF-333mV series were plugged into every piece of equipment or machinery for energy sub-metering of the whole building. We used:
- 5x 3P4W for process machines
- 2x 3P4W for HVAC
- 2x 3P4W for compressors
- One 3P4W for vacuum
- 2x 3P4W for chargers
- 3P4W for lights
- 3P4W for IT
- 3P4W for administration
For the software, the focus has been on securing the installation, from the point of view of the hardware, the VLAN network infrastructure, as well as standard protocols (IP, ModBus, KNX) and open-source software.
First, the host server is based on Linux, and deploys Virtual Machines.
Then the fire-wall secures the whole installation
OpenHAB2 is used to collect and process data from the Multi-GEM. For every 3 phases and the total, it collects:
- Active Power (W)
- Reactive Power (VAR)
- Apparent Power (VA)
- Active Energy (Wh)
- Reactive Energy (VARh)
- Apparent Energy (Vah)
- Power Factor
- Total Harmonics Distortion (%)
- Voltage and current Unbalance (%)
- Frequency (Hz)
- Voltage (V)
- Leak
- Sag and Swell
Data are stored in a database. Around 2500 Measurements are stored every minute without loss of data over the years.
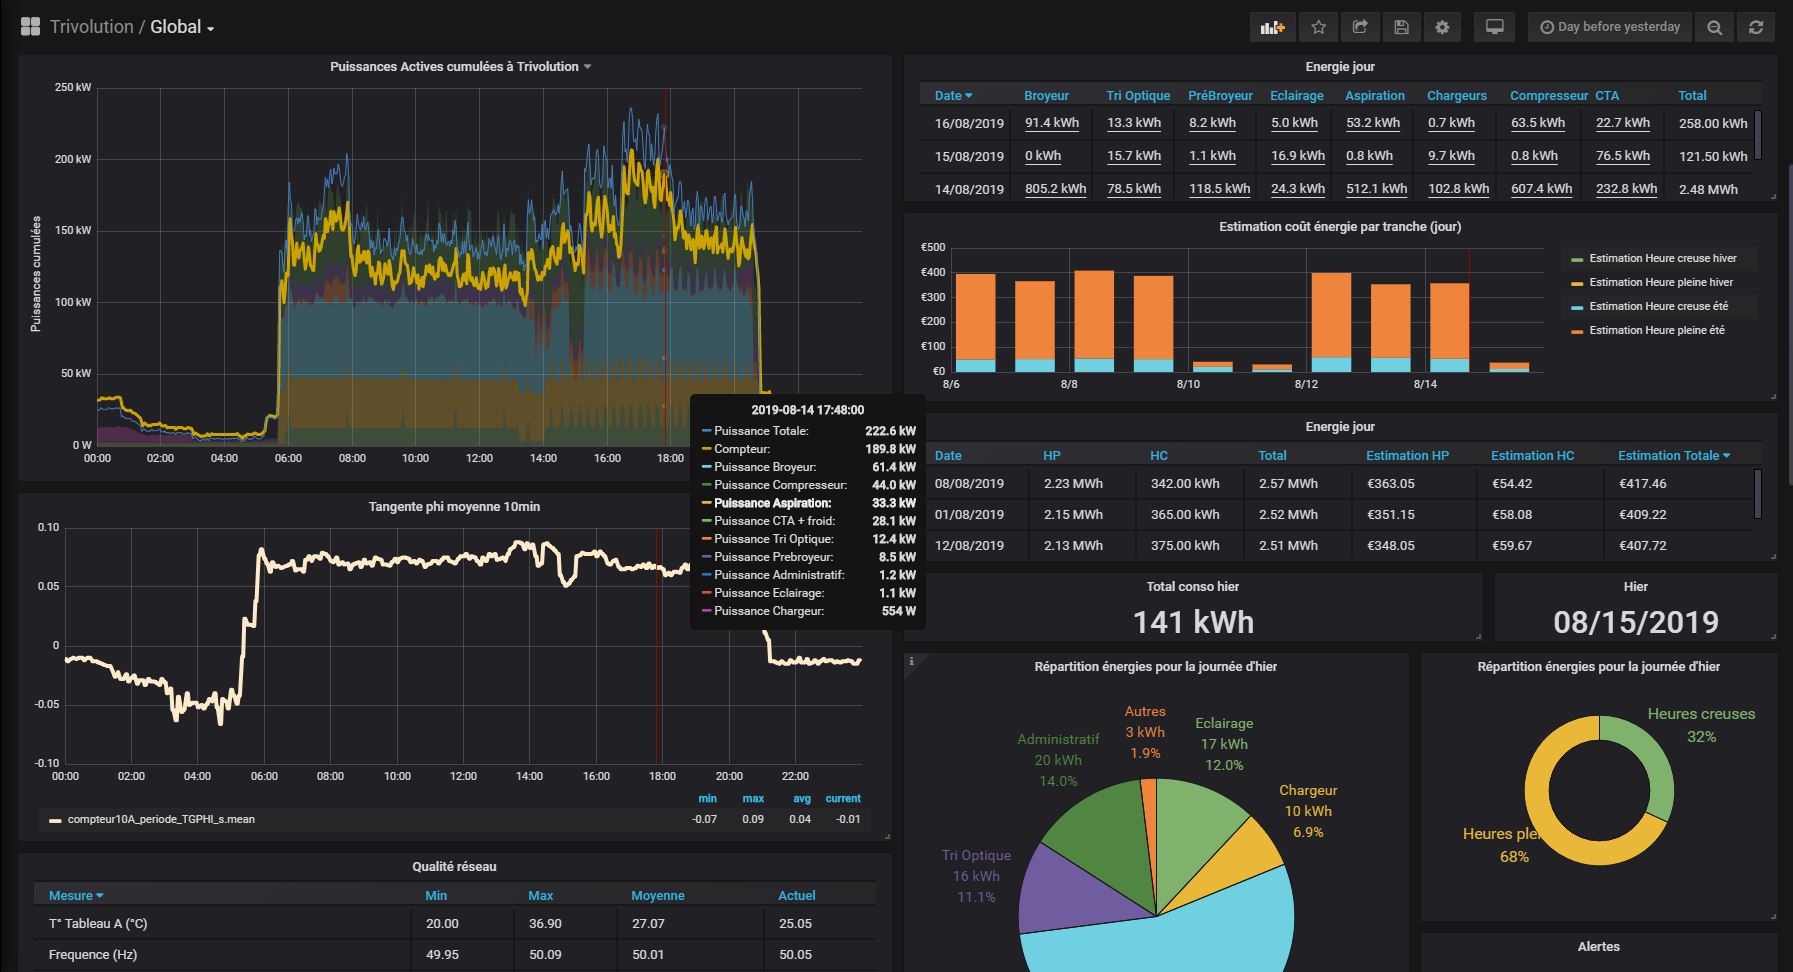
Data visualization is made by the open-source software Grafana. Different analysis can be done depending on the user’s needs. For example:
- The CEO might want to check energy consumption in €, comparing energy efficiency per tons treated and human resources to plan the budget in consideration of the real return on investment.
- The manager might check if everything is functional and adapt processes accordingly.
- Maintenance personnel can evaluate each machine in order to prevent damages, analyze behavior, and plan improvements.


On the back-end, rules can be implemented with software and equipment in order to:
- Optimize energy costs, while charging during night, for example.
- Avoid a blackout when over-current appears.
- Switch off equipment while not in use.
- Improve time efficiency of operators by automating start and stop routines.
- Secure the site, while being plugged in to the alarm and the fire station.
In the near future, the company plans to install 10,000 m² of photovoltaic solar panels over the building for self-consumption and resell.
In the end, we provide managers and customers a 100% open-source, ergonomic and personalized, secured, multi-site, and scalable tool for the future needs of the buildings and its operators.
You can read the Alter&Coop blog post (written in French) on this topic here.